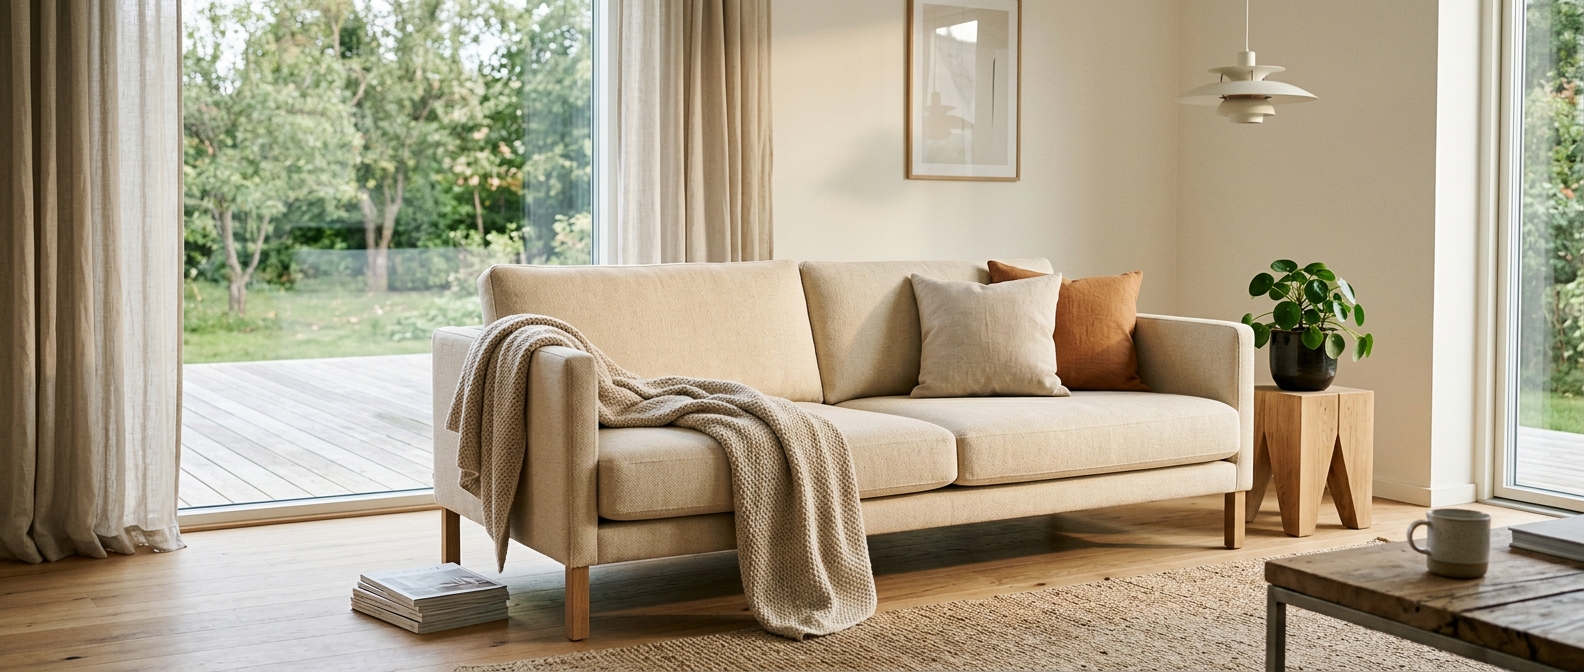
Most advice about furniture product photography is opinion. This report is not. We analysed anonymised usage data from 167 furniture companies in 55 countries that generate product imagery on OmniRoom — 8,303 AI renders created, curated and downloaded between March and August 2026 — to answer three questions: which room styles actually get used, how many images sellers need per product, and which images end up in real listings.
All figures are aggregated and anonymised; no individual company data is shown. OmniRoom's own internal usage is excluded.
The key numbers
Four numbers summarise how furniture sellers work with AI imagery in 2026:
- 1 in 6 — of 8,303 AI renders generated, sellers saved 1,303 to their product libraries (16%). Sellers are selective: they generate widely, then curate hard.
- 6.2 images per product — the average number of saved images per furniture product. Marketplace listings increasingly need a full set (white background + several lifestyle scenes + angles), not a single hero shot.
- 43% — share of saved images that get downloaded for actual use in listings and marketing.
- 55 countries — furniture sellers using AI product imagery span every major e-commerce market; the top five are the United States, France, Türkiye, Germany and the United Kingdom.
The most popular room styles for furniture staging
When sellers stage a product in a styled interior, which styles do they choose? Ranking of the ten most-used styles across 284 style-tagged renders:
| Rank | Room style | Share of styled renders |
|---|---|---|
| 1 | Scandinavian | 15% |
| 2 | Cozy & Warm | 14% |
| 3 | Modern Minimalist | 13% |
| 4 | Custom room (seller-defined) | 11% |
| 5 | Cozy Dopamine | 10% |
| 6 | Industrial | 8% |
| 7 | Farmhouse | 7% |
| 8 | Japandi | 7% |
| 9 | Wabi-sabi | 6% |
| 10 | Urban Loft | 5% |
Three observations: Scandinavian remains the default language of furniture e-commerce; calm, neutral styles (Scandinavian + Japandi + Wabi-sabi + Minimalist) together account for roughly 40% of all styled renders; and 11% of sellers skip presets entirely and describe their own custom room — brand-specific staging is a real need, not an edge case.
The strongest purchase signal: post-editing
The single most striking pattern in the data is what happens after generation. Images that sellers fine-tuned after generating (lighting adjustments, small AI edits) were downloaded for real use 79% of the time. Untouched batch renders were downloaded far less often — 11–20% depending on the tool.
In other words: when a seller invests even one minute of editing in an image, it almost always ends up in a listing. The takeaway for workflow design is clear — generation is exploration, editing is commitment. Tools that make the last 10% of polish easy convert exploration into published imagery.
Where AI furniture imagery is being adopted
Top countries by number of furniture companies using AI product imagery on the platform:
| Country | Companies |
|---|---|
| United States | 24 |
| France | 19 |
| Türkiye | 17 |
| Germany | 13 |
| United Kingdom | 12 |
| Spain | 12 |
| Italy | 7 |
| China | 7 |
Adoption follows furniture manufacturing and marketplace geography: strong clusters in the US, Western Europe and Türkiye (a major furniture manufacturing hub exporting to EU marketplaces).
What this means if you sell furniture online
- Plan for ~6 images per product. That is what sellers actually publish: typically one clean white-background shot, two to three lifestyle scenes and one or two detail/angle shots.
- Start with Scandinavian or warm-neutral staging. They are popular because they work across marketplaces and don't fight the product.
- Generate broadly, curate hard. A 1-in-6 keep rate is normal — treat generation as cheap exploration.
- Budget a minute of polish for hero images. Edited images are the ones that ship; a lighting pass quadruples the odds an image gets used.
Frequently asked questions
Where does this data come from?
Anonymised, aggregated usage data from 167 furniture companies in 55 countries using OmniRoom between March and August 2026 — 8,303 generated renders, 1,303 curated images. No individual company data is disclosed, and OmniRoom's internal usage is excluded.
What is the most popular interior style for furniture product photos?
Scandinavian, used in about 15% of styled renders, followed by Cozy & Warm (14%) and Modern Minimalist (13%). Calm neutral styles collectively dominate furniture staging.
How many product photos does a furniture listing need in 2026?
Sellers in this dataset keep an average of 6.2 images per product — typically a white-background packshot, several lifestyle room scenes and one or two detail or angle shots.
Will this report be updated?
Yes — we plan to refresh these figures quarterly as the dataset grows. This edition reflects data through August 2026.